
The Triangle Pattern: A Forex Trader's Best Friend or Just Another Shape?

The triangle pattern is one of the most popular patterns in Forex trading. Like a reliable friend, it offers trading opportunities both during its formation and after its completion. Understanding the different forms of the triangle pattern can help you develop breakout or predictive strategies to use in your day trading. Plus, it allows you to manage risk and position size with the finesse of a seasoned pro.

1. What Is the Triangle Pattern?
The Triangle Pattern (Triangle) is a price pattern in technical analysis, usually appearing after a market's cycle of rising or falling. This pattern shows a pause in the current trend, where prices tend to converge at a point before breaking out dramatically in one direction. In the triangle, both buyers and sellers are in a standoff, waiting for a clearer signal at the end of the triangle.
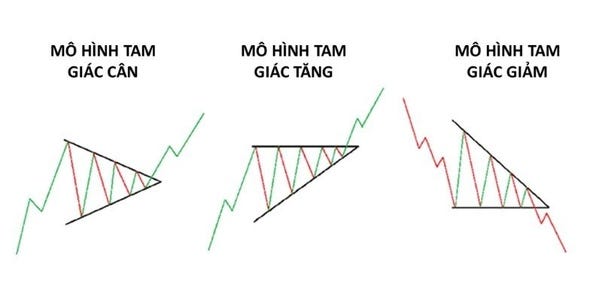
The Triangle Pattern can be classified into three main types:
Symmetrical Triangle: A triangle pattern with two parallel borders forming a symmetrical shape. This is the most common type of triangle and is often considered a continuation pattern.
Descending Triangle: A triangle pattern with a horizontal upper border and a descending lower border, forming a triangle with a narrowing base. This type indicates seller dominance and is often seen as a reversal pattern.
Ascending Triangle: A triangle pattern with a horizontal lower border and an ascending upper border, forming a triangle with a narrowing top. This type indicates buyer dominance and is often seen as a reversal pattern.
2. How to Trade the Triangle Pattern in Forex
To understand better how to trade the Triangle Pattern, let's delve into each specific type.
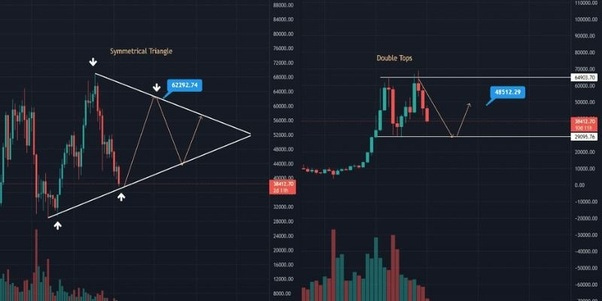
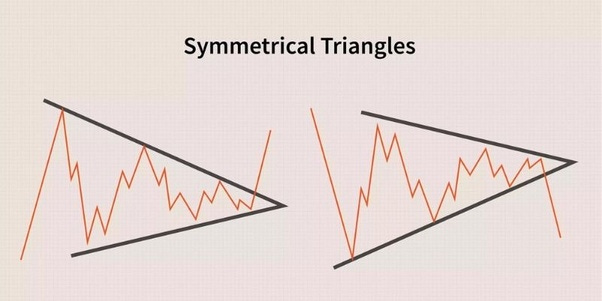
2.1 Symmetrical Triangle
The Symmetrical Triangle is a continuation pattern, showing a pause in the current trend before continuing up or down. The unique feature of this pattern is its parallel borders, indicating a balance between buying and selling forces.
Trading the Symmetrical Triangle successfully requires attention to these factors:
Triangle Timeframe: The timeframe of the Symmetrical Triangle can range from a few weeks to several months. To identify the market's main trend, observe the chart across multiple timeframes. If different timeframes show an uptrend or downtrend, the Symmetrical Triangle can be seen as a continuation signal.
Identifying Breakout Direction: The breakout point of the Symmetrical Triangle can occur at any peak or trough. To determine the breakout direction, consider the following:Breakout at the Peak: If the breakout happens at the peak, the trend will likely continue upward. You can open a buy order when the price crosses the upper border of the triangle and set a stop loss at the lowest price of the triangle.Breakout at the Trough: If the breakout happens at the trough, the trend will likely continue downward. You can open a sell order when the price crosses the lower border of the triangle and set a stop loss at the highest price of the triangle.
Risk Management: As with any trading strategy, risk management is crucial for success with the Symmetrical Triangle. Set a stop loss at a safe price level and always follow the 1:2 risk management principle or higher.
2.2 Descending Triangle
The Descending Triangle is a reversal pattern, indicating seller dominance and forecasting a future downtrend. Its unique feature is a horizontal upper border and a descending lower border, forming a triangle with a narrowing base.
Trading the Descending Triangle successfully requires attention to these factors:
Triangle Timeframe: The timeframe of the Descending Triangle usually ranges from a few weeks to several months. However, also observe the chart across multiple timeframes to identify the market's main trend.
Identifying Breakout Point: The breakout point of the Descending Triangle can occur at the base or the lower border of the triangle. To determine the breakout direction, consider the following:Breakout at the Base: If the breakout happens at the base, the trend will likely continue downward. You can open a sell order when the price crosses the lower border of the triangle and set a stop loss at the highest price of the triangle.Breakout at the Lower Border: If the breakout happens at the lower border of the triangle, the trend will likely continue downward. You can open a sell order when the price crosses the lower border of the triangle and set a stop loss at the highest price of the triangle.
Risk Management: With the Descending Triangle, also follow the 1:2 risk management principle or higher to protect your investment.
2.3 Ascending Triangle
The Ascending Triangle is a reversal pattern, indicating buyer dominance and forecasting a future uptrend. Its unique feature is a horizontal lower border and an ascending upper border, forming a triangle with a narrowing top.
Trading the Ascending Triangle successfully requires attention to these factors:
Triangle Timeframe: The timeframe of the Ascending Triangle usually ranges from a few weeks to several months. However, also observe the chart across multiple timeframes to identify the market's main trend.
Identifying Breakout Point: The breakout point of the Ascending Triangle can occur at the top or the upper border of the triangle. To determine the breakout direction, consider the following:Breakout at the Top: If the breakout happens at the top, the trend will likely continue upward. You can open a buy order when the price crosses the upper border of the triangle and set a stop loss at the lowest price of the triangle.Breakout at the Upper Border: If the breakout happens at the upper border of the triangle, the trend will likely continue upward. You can open a buy order when the price crosses the upper border of the triangle and set a stop loss at the lowest price of the triangle.
Risk Management: With the Ascending Triangle, also follow the 1:2 risk management principle or higher to protect your investment.
3. Tips for Using the Triangle Pattern
Here are some important tips when using the Triangle Pattern in stock/Forex trading:
Don’t Rely Solely on One Pattern: Don’t base your trading decisions solely on one pattern. Combine it with other indicators and analyses for more accurate decisions.
Use Different Timeframes: Use the Triangle Pattern alongside different timeframes to identify the main market trend.
Always Follow Risk Management Principles: Always follow risk management principles and set a safe stop loss to protect your investment.
Be Cautious in Volatile Markets: Be cautious when trading the Triangle Pattern in highly volatile markets, as it can reduce the pattern's accuracy.
4. Pros and Cons of the Triangle Pattern
The Triangle Pattern is a popular chart pattern in technical analysis, providing valuable information about potential price movements for traders. Here are some pros and cons to keep in mind:
4.1 Pros:
Clear Entry and Exit Points: This pattern provides clear entry and exit points for traders. When a breakout occurs, traders can enter the market in the breakout direction and place stop-loss orders to limit risk.
High Success Probability: The Triangle Pattern has a high success probability as it indicates the market is taking a break before continuing in the trend direction. Traders can use this pattern to confirm the trend direction and increase the success probability.
Usable on Different Timeframes: The Triangle Pattern can be used on various timeframes, from minutes to months, allowing for both short-term and long-term trading.
Can Be Combined with Other Technical Tools: The Triangle Pattern can be combined with other technical tools to increase success probability, such as trend lines, moving averages, and oscillators.
4.2 Cons:
False Breakouts: False breakouts can occur when the price moves out of the triangle pattern, only to quickly reverse direction, leading to incorrect trades and losses.
Time-Consuming: The Triangle Pattern can take a long time to develop, which can be frustrating for traders looking for quick trades.
Requires Patience: Trading with the Triangle Pattern requires patience, as traders need to wait for the pattern to fully develop before making trading decisions.
5. Conclusion
The Triangle Pattern is a useful tool to help you make trading decisions in the stock/Forex market. However, to use this pattern effectively, you need to master important factors such as timeframe, identifying breakout points, and risk management. Additionally, combine the Triangle Pattern with other tools and analyses for accurate trading decisions. We hope this article has helped you understand the Triangle Pattern and how to use it in trading. Happy trading!
Want to become a wise investor and master the art of trading? Check out my book here to learn everything you need to know and transform your trading skills!
At the same time, if you want to learn more about SMC, you can order the book here. This is a book written by the author himself and has been published on Amazon and Gumroad. Best regards!